General description #
Reports are documents that give you planned and statistical data, usually for a specific purpose. Qbil-Trade offers many reports that provide real-time insights, figures, and statistics. These reports are the main outputs of the system, helping you understand trading information better. You can find various reports that cover planning, stock, contracts, currency position, and profit and loss. Since the data is available in real time, you always get the most up-to-date information.
In Qbil-Trade, customers have access to several default reports, such as Position Overview, Purchase Processing, and Sales Processing. These generic reports are available to all users. Additionally, other reports are available based on the specific settings and features enabled for each customer. For instance, the Claims Report is only accessible to customers who have the Claims Module enabled.
In Qbil-Trade, there are five categories of reports, organized into five columns based on their purpose. The columns are:
Features #
The web reports offer a variety of distinctive features that enable users to extract real-time data and perform various data analytics tasks efficiently.
- The web reporting tool in Qbil-Trade offers easy interaction and an enhanced user experience. You can access web reports on any browser without needing to install third-party applications like MS Office. All reports available in the [Excel version] (internal_link url=”help/getting-started/reports/excel-reports/”) are also available on the web, along with additional functionalities.
- With the web version, you can edit and customize the data in reports by selecting, sorting, and rearranging columns from the generic reports. You can view these reports directly in the browser or download them as .xlsx files using the “Export as Excel” button. You can also create new custom reports from existing ones by choosing the columns you need and saving the customized report with a unique name. The saved report will be available for viewing and editing, just like the existing reports. The creator of a custom web report can save changes to the custom report, which isn’t possible with default reports. Additionally, you can share customized reports with other users.
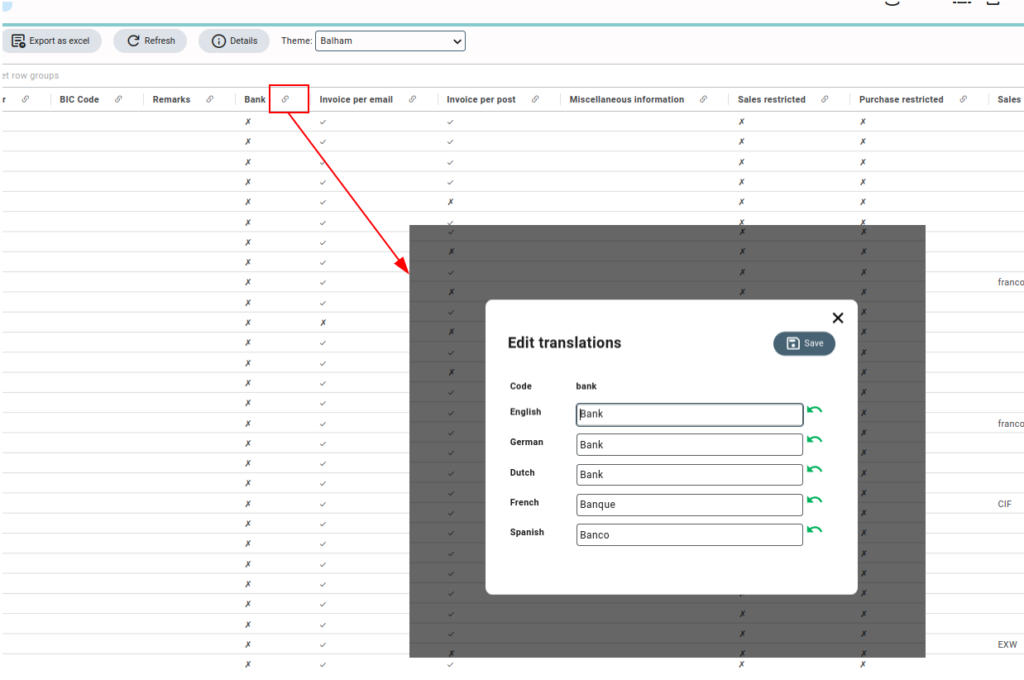
- The labels of column headers are very consistent across the multiple reports. Hovering over a column header will display a short description or tooltip of the column header. You can change the translations of the column headers as per your preference. To update the translations of column headers, hold CTRL and double-click on the link icon of the column header.
- The web reports in Qbil-Trade offer a Pivoting feature, which lets you display summarized values for specific fields. For example, you can pivot on the currency field to create rows for different currencies like EUR, USD, and GBP, showing the total count for each. If you enable pivoting on the sum column, the report will show two columns: subsidiary and sum, with the sum for each currency displayed in the currency column.

- Another feature in the web reports is Themes, which allow you to customize the overall look of the reports. The available themes include Alpine, Balham, Blue, Material, and Dark.

- Additionally, the web reports provide various features to simplify your operations and enhance the user interface. These features include sorting, grouping, and filtering columns, grouping rows, and aggregating values in numbered columns. You can also change the format of numbered values by clicking the hamburger menu icon on each column header.
- There is a feature available in the web report called “Additional Filters”, which allows filtering and extraction of data from the report as per the selection made. These additional filters can be of various types like date, order type, cost type, etc. The additional filters can be added as per the user requirement and functionality of the report.

- Web reporting tool also includes a convenient search functionality to quickly locate and access any report, whether it’s a default report or a custom one. You can search for any report using the reports dropdown in the search option on the tool bar.

Sharing Reports #
Web report sharing in Qbil-Trade can be classified into two parts:
- Report sharing by Admin.
- Report sharing by regular users.
Report Sharing by admin #
The generic web reports are only accessible to administrators. Administrators in Qbil-Trade are the users for whom the administrator permission in the permissions screen has the access right to “Delete”. Regular users can only see the reports if administrators share any reports with these users and have the access right to at least “view” to permission “Web report”.

The administrator can share reports (general and custom) with other users either from the reports overview screen or directly from the report screen.
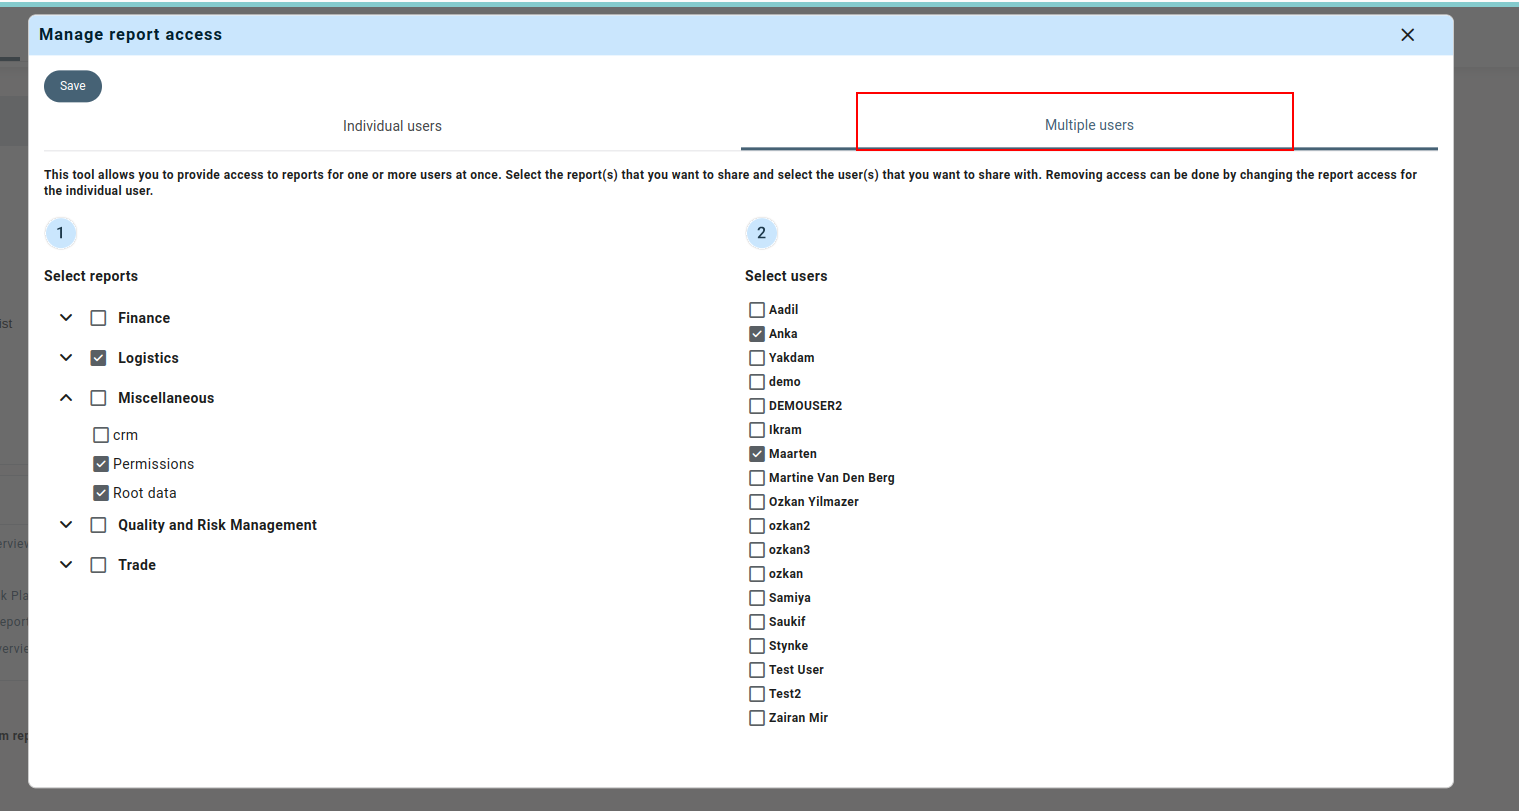
- From the reports overview, reports (general and custom) can be shared in two ways: “individually for each user” and “in bulk for multiple users” using the tabs in the “Manage report access” option.
Please note that the “manage report access” option is available to administrators only.

-
- Individual Users (sharing per user): You (admin) can assign/unassign multiple reports to users (depending on the user’s role or the requirements of his work) using this tab. The tab thus allows you to share specific reports, groups, or report categories with individual users. This can be useful in situations where you need to grant different levels of access to different users as per their roles.
You can select a user and check (to assign) or uncheck (to unassign) the report or report category permission for the user. You can assign multiple reports from various report groups and report categories to a user. You can also assign full report categories or report groups using the checkbox for the group or category.
- Individual Users (sharing per user): You (admin) can assign/unassign multiple reports to users (depending on the user’s role or the requirements of his work) using this tab. The tab thus allows you to share specific reports, groups, or report categories with individual users. This can be useful in situations where you need to grant different levels of access to different users as per their roles.

-
- Multiple users (bulk sharing): Bulk permissions allow you (admin) to assign multiple reports to multiple users at once, rather than individually assigning reports to each user. This can be useful in situations where you need to quickly assign reports to a large number of users.
To assign multiple reports to multiple users select the report category/categories and select the users (multiple) with whom you want to share the selected reports, then save the changes. By doing so, you can give multiple users access to multiple reports at once.
Please note that you can use the “individual users” tab to change or remove a user’s access to reports.
- Multiple users (bulk sharing): Bulk permissions allow you (admin) to assign multiple reports to multiple users at once, rather than individually assigning reports to each user. This can be useful in situations where you need to quickly assign reports to a large number of users.
- From the report screen, the administrator can also share a web report with other users directly by clicking on the “Details” button in the report. Multiple users can be selected in the list of users by CTRL + clicking on the username and clicking the save button.

Report sharing by regular users #
Regular users can only share with other users the custom reports they have made. They can share these reports by clicking the “Details” button on the report screen and choosing the user(s) they want to share it with.

Custom Reports #
Custom reports are customized reports that are created from existing reports or general reports. You can use existing web reports to create new custom reports as per your requirements and share them with other users.
You can also create custom reports from the already created reports.
It is important to note that any custom report made by any regular user is visible to the admin by default. Thus admin can share these reports with any of the other users.
Creating a custom web report #
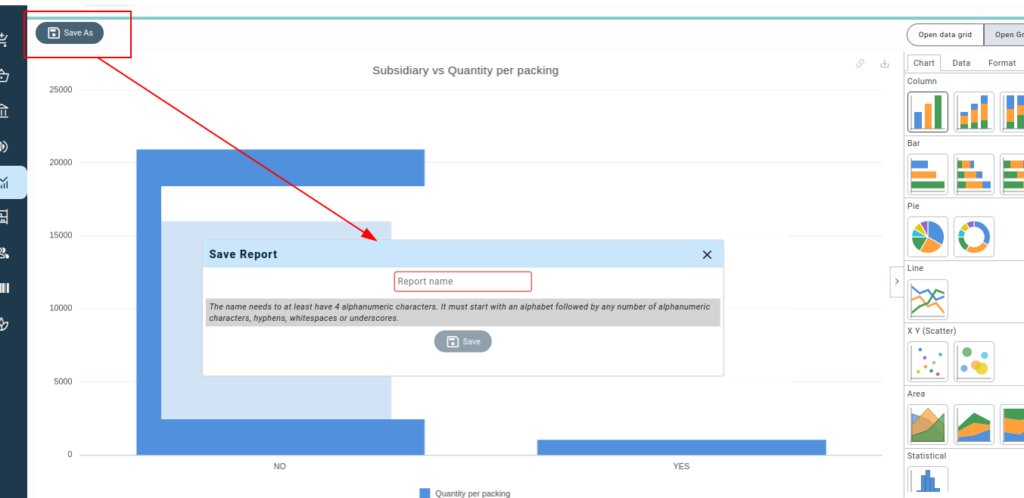
Make required changes to the existing report by applying filters to columns, hiding unnecessary columns, adding row groups, or applying aggregation functions (sum, avg, min, max, etc.) on the columns. After making the changes, click the “Save as” button from the button panel of the screen and enter a name to create your custom report.
Note: If you use a name that is already used for another report (basic or custom), you will not be able to save the report.
After creating a new custom web report, a pop-up (alert) with the message “Report created successfully! Click here to open it” will be displayed. You can open the newly created custom report by clicking on the underlined text. The custom web reports are visible only to the administrators, users who created them and the users with whom the reports are shared.


Opening a custom web report #
To open the custom web report from the main reports screen, reload the reports overview tab and look for the custom report in the same category as its parent. You can alternatively use CTRL+F to look for the report.
The icon “C” that is displayed next to the report name in the report overview screen helps to distinguish the custom reports from the general reports.

Sharing a custom web report #
You can share the custom web report created by you with other regular users with access to reports. However, regular users cannot share them further with any other user. The administrator, however, can share this custom report with any other user.
Deleting a custom web report #
Regular users and administrators can create custom reports, which can be deleted if needed. A regular user can delete their own custom report, while an administrator has the authority to delete any custom report created by any other user. If a regular user deletes their own custom report, they can restore it themselves. However, an administrator can restore any custom report deleted by any user.

Exporting web reports #
The web reports can also be downloaded locally in excel format using the button Export to Excel. You can use the filters and other features in the exported web reports.
Report Graphs #
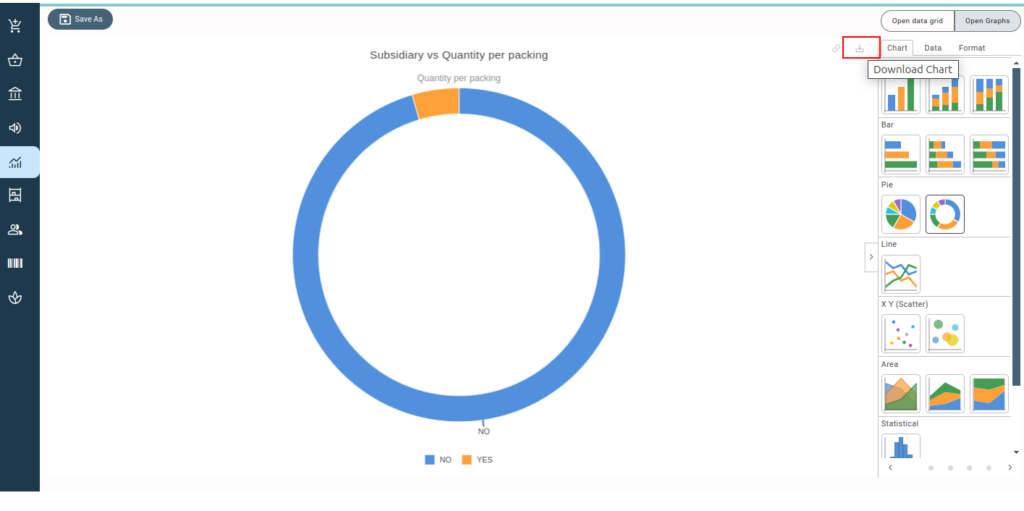
The graph feature is also available in Qbil-Trade’s web reports module to improve data analysis and visualization. Real-time data integration is supported by the graphs, enabling dynamic updates and guaranteeing that they always represent real time data.
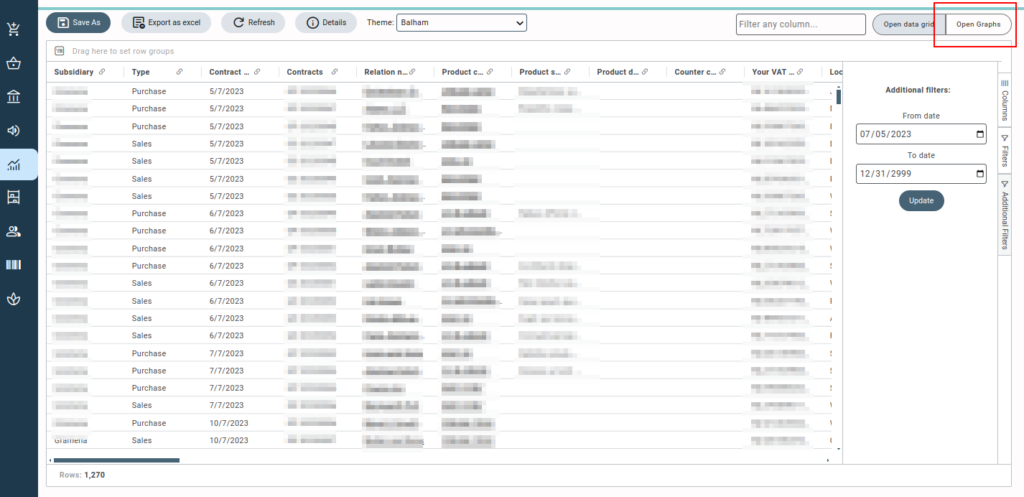
You can navigate to the graph of report using the toggle button “Open Graphs.” By default, the data is depicted in bar graph, but you can change that using the chart options on the tool panel on left side as per your requirement.
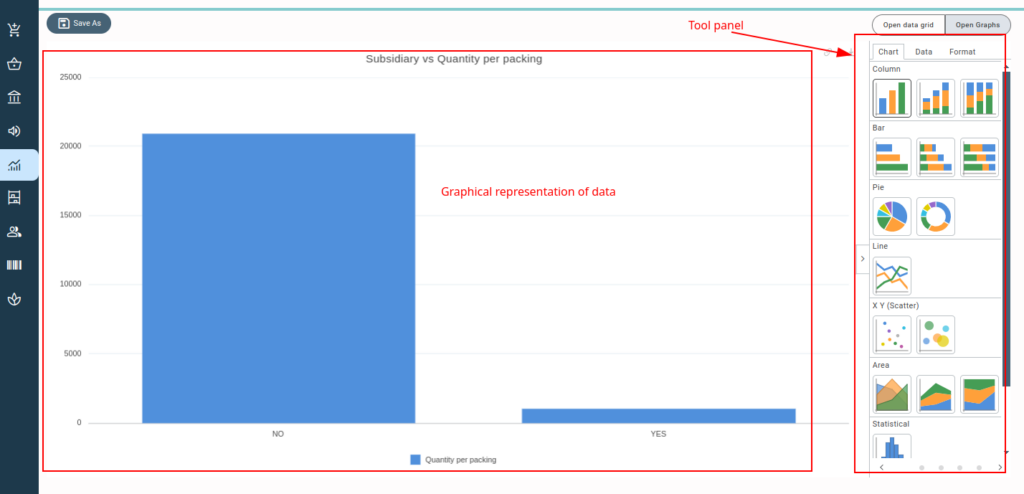
The graph displays data from the first text (category) column and the numeric (series) column of the report by default. However, these settings can be adjusted using the data options on the tool panel. Once the graph is generated for a report, the columns used in the graph for data visualization are highlighted in the report. The text (category) column is highlighted in green, and the numeric (series) column is highlighted in blue.

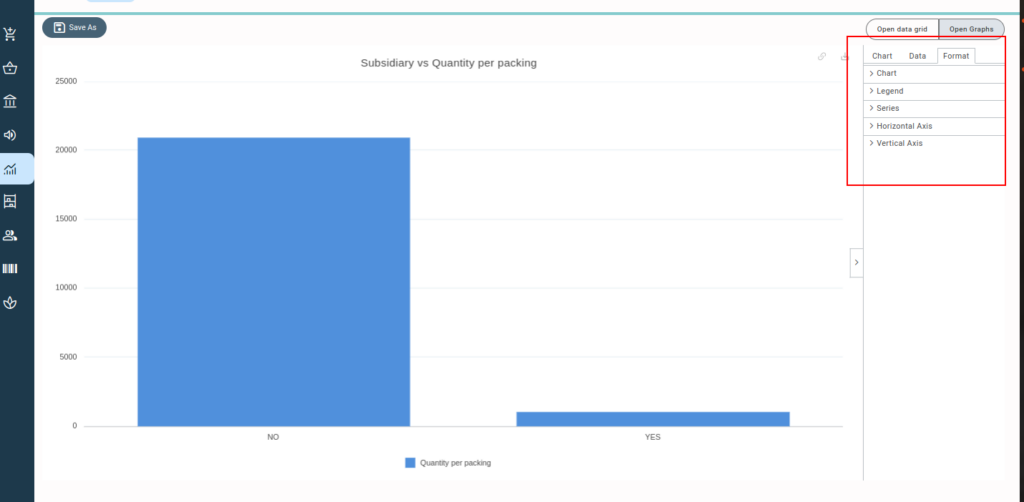
Furthermore, you can change the formatting of the various graph elements using the format tab of tool panel.
You can also save the changes made to the graph using the “Save As” button. The saved changes to the graph will be displayed in the custom report created for the graph.
You can use the “download” option to export a report’s graph, which you can then use locally for various business needs such as emailing.
